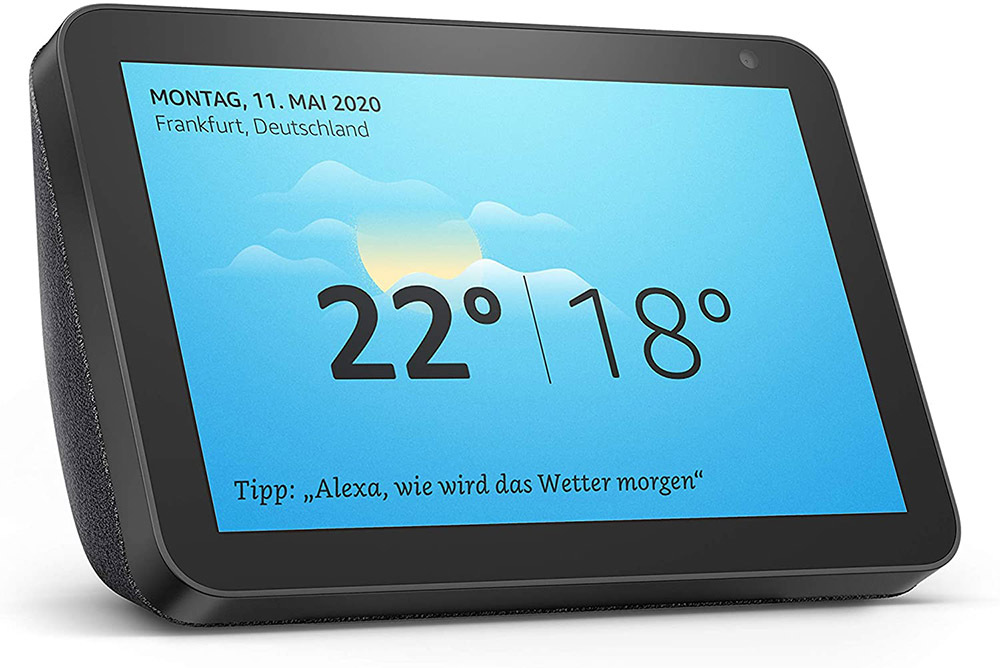
Tutti conosciamo Alexa, l’assistente vocale di Amazon, utilizzato per le più diverse attività domestiche e non solo. In questo articolo vediamo come utilizzare un dispositivo Echo Show per realizzare una interfaccia per i nostri sistemi SlimLine. Abbiamo sviluppato applicazioni su SlimLine con interazione vocale di Alexa, ma in questo articolo non utilizzeremo l’interfaccia vocale, sfrutteremo il dispositivo solo come browser web, quindi l’esempio riportato è utilizzabile anche da qualsiasi browser.
Il web browser nativo di Echo Show è Amazon Silk si attiva con il comando “Alexa, esegui Silk“, dalla barra indirizzi del browser digitare la pagina da visualizzare. Nel nostro esempio la pagina verrà fornita dal server web dello SlimLine.
Dati meteorologici
Anche se Echo Show ha una sua completa sezione meteorologica, ho inserito nell’esempio l’acquisizione dei dati meteorologici tramite l’API di un servizio cloud, tra i moltissimi servizi presenti ho scelto OpenWeather che oltre al piano a pagamento offre un servizio gratuito che prevede 60 richieste al minuto con un massimo di 1.000.000 richieste al mese. Per utilizzare il servizio occorre registrarsi, Vi verrà fornita una API key da utilizzare nelle richieste.
Utilizzando l’API Current weather data, è possibile accedere ai dati meteorologici attuali di oltre 200.000 città nel mondo, i dati ritornati sono disponibili in formato JSON, XML o HTML. Per testare l’API è possibile dal browser richiedere le informazioni meteo della città di Milano digitando la richiesta sottoriportata (Sostituire {API key} con la chiave ricevuta con la registrazione, esempio “0123456789abcdef0123456789abcdef”. Affinchè l’API Key si attivi occorre attendere un paio d’ore dopo la registrazione.
Eseguendo da browser la richiesta dell’url:
https://api.openweathermap.org/data/2.5/weather?q=Milano&appid={API key}&units=metric
Si riceverà una stringa in formato JSON con tuti i dati relativi:
{“coord”:{“lon”:9.1895,”lat”:45.4643},”weather”:[{“id”:802,”main”:”Clouds”,”description”:”scattered clouds”,”icon”:”03d”}],”base”:”stations”,”main”:{“temp”:23.25,”feels_like”:22.88,”temp_min”:20.94,”temp_max”:24.86,”pressure”:1014,”humidity”:48},”visibility”:10000,”wind”:{“speed”:0.89,”deg”:145,”gust”:2.24},”clouds”:{“all”:40},”dt”:1629358702,”sys”:{“type”:2,”id”:2012644,”country”:”IT”,”sunrise”:1629347339,”sunset”:1629397503},”timezone”:7200,”id”:3173435,”name”:”Milan”,”cod”:200}
La richiesta è possibile anche da HTTP, ecco il programma WeatherData che utilizza il FB HTTPClient per effettuare la richiesta ed acquisire i valori di temperatura, umidità e pressione atmosferica. I valori acquisisti sono trasferiti in variabili globali che saranno poi visualizzate nella pagina web utilizzando TAGs come indicato in questo articolo.
Per rendere più gradevole la visualizzazione dei valori ho utilizzato gli strumenti messi a disposizione da Google Charts. Il programma è essenziale nella visualizzazione dei dati quindi non è previsto l’aggiornamento automatico in AJAX preferendo utilizzare un tasto di ricarica della pagina.

Programma di esempio
Ogni 30 secondi viuene effettuata una richiesta al server OpenWeatherMap dei dati meteorologici della zona definita (Il campo appid deve essere definito con l’ID richiesto al server tramite registrazione gratuita). Dai dati ricevuti vengono estratte le informazioni di temperatura, umidità e pressione che possono essere visualizzate da un browser accedendo all’indirizzo IP del sistema alla pagina Home.htm.
Programma LogicLab (Ptp191)
PROGRAM OpenWeatherMap

VAR CONSTANT
    PSize : UINT := 1024; (* Page size *)
END_VAR

VAR
    CaseNr : USINT; (* Program case *)
    Error : UDINT; (* Execution error counter *)
    TimeBf : UDINT; (* Time buffer (mS) *)
    Page : @STRING; (* Page string *)
    HOutside AT %MD100.4 : REAL; (* Outside humidity (%) *)
    TOutside AT %MD100.0 : REAL; (* Outside temperature (°C) *)
    APressure AT %MD100.8 : REAL; (* Atmosferic pressure (mbar) *)
    HTTPRq : HTTPClient_v5; (* HTTP client *)
    TCPClient : SysTCPClient; (* TCP client management *)
END_VAR

// *****************************************************************************
// PROGRAM "OpenWeatherMap"
// *****************************************************************************
// The program acquires the weather conditions from the openweathermap API.
//
// Bibliography: https://openweathermap.org
// The free plan includes 60 calls/minute, up to 1,000,000 calls/month
// api.openweathermap.org/data/2.5/weather?q=Casale monferrato&appid=b82464e5d8b66e1089caabb733c4f9ec&units=metric
// -----------------------------------------------------------------------------

    // -------------------------------------------------------------------------
    // INITIALIZATIONS
    // -------------------------------------------------------------------------
    // Program initializations.

    IF (SysFirstLoop) THEN

        // Set TCPClient parameters.

        TCPClient.PeerAdd:=ADR('api.openweathermap.org'); //Peer address
        TCPClient.PeerPort:=80; //Peer port
        TCPClient.LocalAdd:=ADR('0.0.0.0'); //Local address
        TCPClient.LocalPort:=0; //Local port
        TCPClient.FlushTm:=50; //Flush time (mS)
        TCPClient.LifeTm:=20; //Life time (S)
        TCPClient.RxSize:=512; //Rx buffer size
        TCPClient.TxSize:=512; //Tx buffer size

        // Set HTTPClient parameters.
        // Note: To operate change the "app id" according to your API key.

        HTTPRq.SpyOn:=FALSE; //Activate the spy
        HTTPRq.KeepAlive:=FALSE; //HTTP keep-alive
        HTTPRq.RMethod:=HTTP_REQUEST#HTTP_GET; //HTTP request method
        HTTPRq.HostName:=ADR('api.openweathermap.org'); // Hostname
        HTTPRq.Page:=ADR('data/2.5/weather'); //Web page
        HTTPRq.Request:=ADR('q=Milan&appid=0123456789abcdef0123456789abcdef&units=metric'); //Request string
        HTTPRq.Header:=eNULL; //HTTP header
        HTTPRq.DBSize:=512; //Data buffer size
        HTTPRq.Timeout:=T#10s; //Execution timeout
    END_IF;

    // -------------------------------------------------------------------------
    // HTTP REQUEST
    // -------------------------------------------------------------------------
    // Execute the HTTP request.

    TCPClient(Connect:=HTTPRq.Connect); //TCPClient management
    HTTPRq(Enable:=TRUE, File:=TCPClient.File); //HTTP client

    // Eseguo log su errore.

    IF ((HTTPRq.Fault) OR (Error > 10)) THEN
        Error:=0; //Error counter
         CaseNr:=0; //Program case
     END_IF;

    // -------------------------------------------------------------------------
    // PROGRAM SEQUENCIES
    // -------------------------------------------------------------------------
    // Program sequencies.

    CASE (CaseNr) OF

        // ---------------------------------------------------------------------
        // Initialize the time to manage acquisition delay.

        0:
        HTTPRq.Send:=FALSE; //Send request
        TimeBf:=SysTimeGetMs(); //Time buffer (mS)
        eTO_JUNK(SysRMFree(ADR(Page))); //Fre memory
        CaseNr:=CaseNr+1; //Program case

        // ---------------------------------------------------------------------
        // Wait delay time then initialize buffers and enable client.

        1:
        IF ((SysTimeGetMs()-TimeBf) < TO_UDINT(T#30s)) THEN RETURN; END_IF;
        IF NOT(SysRMAlloc(PSize, ADR(Page))) THEN RETURN; END_IF;
        HTTPRq.Send:=TRUE; //Send request
        CaseNr:=CaseNr+1; //Program case

        // ---------------------------------------------------------------------
        // Header/Page data are received from server by chunked. When a chunk
        // has been received DBChars returns its length.

        2:
        IF ((HTTPRq.DBChars <> 0) AND (HTTPRq.HPSelector)) THEN
            IF ((Sysstrlen(Page)+HTTPRq.DBChars) < PSize) THEN
                eTO_JUNK(Sysmemmove(eTO_POINTER(Page)+Sysstrlen(Page), HTTPRq.DBAddress, HTTPRq.DBChars));
            END_IF;
        END_IF;

        // On Done it's possible to test if page has been loaded.

        IF (HTTPRq.Done) THEN
            IF NOT(HTTPRq.PLoad) THEN Error:=Error+1; CaseNr:=0; RETURN; END_IF;
            CaseNr:=CaseNr+1; //Program case
        END_IF;

        // ---------------------------------------------------------------------
        // The JSON answer string has been received, its possible to extract
        // from it the values.

        3:
        IF NOT(SysVsscanf(SysStrFind(Page, ADR('"temp":'), FIND_GET_END), ADR('%f'), REAL_TYPE, ADR(TOutside))) THEN Error:=Error+1; END_IF;
        IF NOT(SysVsscanf(SysStrFind(Page, ADR('"humidity":'), FIND_GET_END), ADR('%f'), REAL_TYPE, ADR(HOutside))) THEN Error:=Error+1; END_IF;
        IF NOT(SysVsscanf(SysStrFind(Page, ADR('"pressure":'), FIND_GET_END), ADR('%f'), REAL_TYPE, ADR(APressure))) THEN Error:=Error+1; END_IF;
        CaseNr:=0; //Program case
    END_CASE;

// [End of file]
Pagina web di visualizzazione
<!DOCTYPE html PUBLIC "-//W3C//DTD XHTML 1.0 Transitional//EN" "http://www.w3.org/TR/xhtml1/DTD/xhtml1-transitional.dtd">
<html xmlns="http://www.w3.org/1999/xhtml">
<head>
<meta http-equiv="Content-Type" content="text/html; charset=utf-8" />
<title>Home</title>
<style type="text/css">
<!--
.Normal {
    font-family: Arial, Helvetica, sans-serif;
    font-size: 12px;
    font-style: normal;
}
.Bolded {
    font-family: Arial, Helvetica, sans-serif;
    font-size: 14px;
    font-style: normal;
    font-weight: bold;
}
.TitleTable {
    font-family: Arial, Helvetica, sans-serif;
    font-size: 24px;
    font-style: normal;
    font-weight: bold;
    color: #090;
}
-->
</style>
<script type='text/javascript' src='https://www.google.com/jsapi'></script>
<script type='text/javascript'>
// Bibliografy: https://developers.google.com/chart
    google.load('visualization', '1', {packages:['gauge']}); //Google Visualization API
    google.setOnLoadCallback(drawChart); //Call fuction that draws objects
    // -----------------------------------------------------------------------------
    // FUNCTION "drawChart()"
    // -----------------------------------------------------------------------------
    // This function draws all page objects.

    function drawChart()
    {
        var data=google.visualization.arrayToDataTable([['Label', 'Value'], ['Temp.', <!--['%03.1f', REAL, 0]-->],]);
        var options={height:150, min:-20, max:40, greenFrom:-20, greenTo:0, yellowFrom:30, yellowTo:40, minorTicks:5};
        var chart=new google.visualization.Gauge(document.getElementById('Temperature'));
        chart.draw(data, options);
        var data=google.visualization.arrayToDataTable([['Label', 'Value'], ['Humidity', <!--['%03.1f', REAL, 4]-->],]);
        var options={height:150, min:0, max:100, greenFrom:25, greenTo:75, minorTicks:5};
        var chart=new google.visualization.Gauge(document.getElementById('Humidity'));
        chart.draw(data, options);
        var data=google.visualization.arrayToDataTable([['Label', 'Value'], ['Pressure', <!--['%03.1f', REAL, 8]-->],]);
        var options={height:150, min:920, max:1100, greenFrom:990, greenTo:1030, minorTicks:5};
        var chart=new google.visualization.Gauge(document.getElementById('Pressure'));
        chart.draw(data, options);
    }
</script>
</head>
<body>
    <table width="100%">
        <tr>
            <td colspan="3" class="TitleTable">Weather data</td>
        </tr>
        <tr>
            <td align="center" class="Normal"><div id='Temperature'></div></td>
            <td align="center" class="Normal"><div id='Humidity'></div></td>
            <td align="center" class="Normal"><div id='Pressure'></div></td>
        </tr>
        <tr>
            <td align="center" class="Bolded">Temperature (°C)</td>
            <td align="center" class="Bolded">Humidity (%)</td>
            <td align="center" class="Bolded">Pressure (mbar)</td>
        </tr>
        <tr>
            <td align="center" class="Normal"><input type="text" size="4" maxlength="4" value="<!--['%03.1f', REAL, 0]-->"/></td>
            <td align="center" class="Normal"><input type="text" size="4" maxlength="4" value="<!--['%03.1f', REAL, 4]-->"/></td>
            <td align="center" class="Normal"><input type="text" size="4" maxlength="4" value="<!--['%03.1f', REAL, 8]-->"/></td>
        </tr>
        <tr>
            <td colspan="3"><input type="submit" onClick="window.location='Home.htm'" name="button" style="width:100%; height:50px" value="Page reload" /></td>
        </tr>
    </table>
</body>
</html>